Showing posts with label Visualization. Show all posts

November 4, 2010

My First Foray into Data Visualization with Exoplanets

Einstein said, "If I can't picture it, I can't understand it." This statement proved itself to be true on my first foray into Data Visualization. And let me add that it was absolutely a fun experience being able to play around with all the data using the excellent tool provided by "Many Eyes" which was instrumental in helping to reveal insights that lay hidden within those rows and columns of numbers. And of course, it wouldn't be possible at all without the data! So I am thankful for the folks at exoplanets.org for providing the dataset.

Now I realized that, "If you can't explain it simply, you don't understand it well enough." Yes, Einstein also said that. And I think that is the final part of Data Visualization (which i presume overlaps with Data Journalism in some way, too). It was fun generating the visualizations, and analyzing them to find insights was challenging--but it is not complete without the ultimate goal of communicating what I have discovered.

Sure, the pictures speak for themselves (in more than a thousand words), but there is an added benefit in formulating a simple statement to convey the insight: it makes you learn the concept even more. Finally, being able to share that understanding completes the joy.

Let me warn you that I am not a scientist, so please bear with me as i briefly explain my own original findings from these pictures (and please correct me if i'm wrong). Also let me iterate that I'm not a designer or an artist, so the graphics presented in this post are no match compared to the aesthetics of David McCandless (Visual Miscellaneum), and the analytical prowess of Edward Tufte (Envisioning Information).

The conclusion(s) I've drawn from the visuals pretty much explains it concisely. The additional notes are supplementary.


Fig. 1: Visual Magnitude vs Discovery Method (used to find the exoplanet)
Conclusion: The magnitude or brightness of host stars whose planets were discovered via Transit Method are generally dimmer than those stars whose planets were discovered via Radial Velocity (RV) Method. Here's another proof.
Analysis:
Transit Method works best on dimmer stars because it does not drown out its own planets in its glare as much as a bright star would. Radial Velocity (RV) method works best on brighter stars for better spectographic analysis.

Fig. 1: Visual Magnitude vs Discovery Method

Notes:The label delineating the two methods are not noticeable so i need to point out that the left section are those host stars with planets were discovered via RV method. The smaller section on the right with a noticeably darker shade are those stars with transiting planets.
The dimmer tint for high values of Visual Magnitude (V) fits well with the fact that stars with a higher value of magnitude (V) are actually dimmer than those with a lower value.
[Link to the interactive version at Many Eyes]


Fig. 2: Discovery Method vs. Exoplanet Names
Conclusion: Exoplanets discovered via RV method have more "generic" sounding names than those discovered via transit method.
Analysis:
Here's a nice tip on how to quickly guess whether an exoplanet was discovered via RV or transit method: If it's generic-sounding, or if it bears the host star's name (like "HD blah-blah")--then chances are, it’s discovered via Radial Velocity!

Fig. 2: Discovery Method vs. Exoplanet Names
Notes: Exoplanet names are commonly derived from the host star name plus the alphabetical index of the planet by order of its discovery date. Often, the instrument used to discover it are then used in lieu of the star name (for example: Kepler-4 b, or CoRoT-7b)

[Link to the interactive version at Many Eyes]


These are only some of the visualizations I came up with while playing with the exoplanet dataset for around an hour or so. There are definitely many more correlations you can uncover via the other methods at Many Eyes or other tools. Make sure you also play around with the data and let other people know about the insights you come up with. Head over to Many Eyes and use the same data I uploaded to generate your own visualizations.

Disclaimer:
1) These graphs and visualizations are what we can statistically glean from, given the current data provided. The trends I pointed out in this post will change in the next few years. For example: When Kepler starts to announce their discoveries, the number of exoplanets discovered via Transit Method will suddenly skyrocket and overtake the total number of exoplanets discovered via Radial Velocity (RV). (It will be interesting how to visualize that trend when we add the function of time.)
2) Also, these visualizations does not take into account those exoplanets discovered by a mash-up of two or more methods (such as those exoplanets discovered by using Transit method in tandem with RV).

Links:
Many Eyes
Dataset from Exoplanets.org

July 30, 2008

Ephemeral Worlds: Visualizing Exoplanets with Bubbles

Alien WorldIndeed Exoplanetology is the Art and Science of Exoplanets. These photographs of bubbles provide stunning insights into visualizing and imagining how unseen exoplanets might look like. Consider the fact that planets especially Jovian planets like Jupiter, are "bubbles" themselves, albeit gargantuan in scale. The biosphere of the Earth is in fact, a bubble. And by the fractal laws of nature, the surface of bubbles provide a striking resemblance to the appearance of planets with a suitable atmosphere.Alien World
Thus soap bubbles, ephemeral as they may seem - can help in visualizing exoplanets since their surfaces follow the same laws of physics. And as how these photographs by Jason Tozer attests to, exoplanets - like soap bubbles - are also works of art.
One photograph bears a striking resemblance to Jupiter's patterns. I am speculating that if it were photographed in zero-gravity it would look a lot more like Jupiter.
The rest of these otherworldly photographs sets my mind careening into outer space, imagining how exoplanets would look like. To imagine and visualize them is what I can do for now, for to even see a glimpse of them is beyond our lifetime.

July 20, 2008

Exosolar Interface

Visualization of Star Sytems and ExoplanetsJust came across this neat "exosolar" interface done in flash. Exosolar.net is an astronomy site where you can find about 2000 stars and their components (mostly within 75 lightyears). This flash-based interface was created to help visualize star-systems and exoplanets across galaxies, so you can imagine them in space, instead of reading columns of numbers like in a scientific journal.
The interface is sleek and smooth. Its a quick fun to get familiarized with Stars and their planets. The data is taken from The Internet Stellar Database, which is a welcome new addition to our references for Exoplanetologists.
Kudos and thanks to its maker, a Flash-guru named George Margaris.

July 3, 2008

Fetish: Magic Planet for my Bedroom

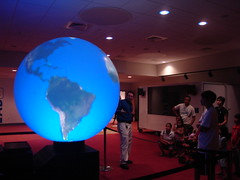
During my recent trip to the newly-renovated Liberty Science Center, a luminous sphere called The Global Microscope became my newest fetish. I later learned that it's called the "Magic Planet", a product from Global Imagination. The "Magic Planet" is indeed magical as it turned, tilted and rotated according to the presenter's whims. Using his wand-like remote control, the presenter provided a grand visual tour of various geologic features of Earth such as tectonic plates, earthquake zones, deep trenches and high areas on the surface of the planet.
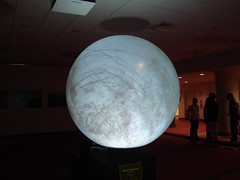
Numerous data sets on various aspects of the earth's climate were also presented - such as a rundown of all the earthquakes and typhoons around the world - using animated graphics superimposed upon varying graphical-representations of the Earth's surface. Europa
The other interesting part of the presentation involved a grand tour of the Solar System, showing all the planets, notably Mars, Venus, Jupiter in crisp detail. Our moon was also shown, as well as Enceladus, and the whole enchilada - Io, Ganymede, and upon my request - Europa.
All this show was done while controlling the tilt and rotation of the globe, and pausing at certain axes to examine points of interest in greater detail. After seeing it all, my curiosity prompted me to investigate it's inner workings.
After examining it up close, I discovered that it's actually a semi-transparent "plastic" sphere with the projector housed inside the base. It's probably similar to how IMAX works (in terms of the projector-lens and dome), except that the computer-generated images being projected from inside the sphere shows through outside the dome's surface. In essence, it's actually a spherized 'computer monitor', obviously tailored to simulate spherical surfaces.
Clearly, this is a wonderful display tool. Perfect for visualizing yet-unseen exoplanets and super-earths, too. I'd love to have one of these in my bedroom, except that I was told it costs around $30,000. Oh well, perhaps I'll just build one someday, DIY-style. So much for my fetish.

links: http://www.lsc.org/educators/jac/globalmicroscope/

May 26, 2008

Exoplanet Visualization Tool (exoExplorer coming soon)

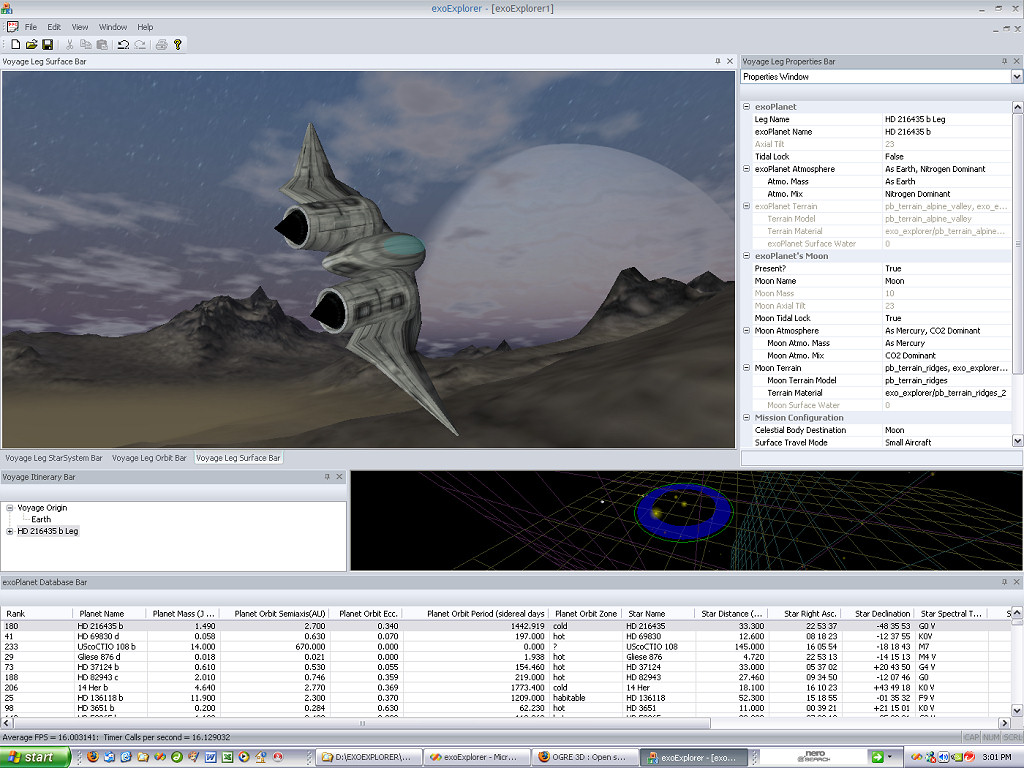
exoExplorerI eagerly await this forthcoming Exoplanet Visualization Tool called 'exoExplorer' being developed by the Planetary Biology Team. The software is set to be released in June 2008.
From the looks of it, the exoExplorer visual interface will depict the exoplanet's surface features and environmental appearance based on its known characteristics as inferred from the exoplanet data.
The interface will be highly interactive - almost like a game, and as such I foresee a kind of immersive 3D experience, and your avatar will be a spaceship or a rover.
Head over to their project page to find out more. June 2008 is just around the corner for its release. I'll keep you posted.